Figure Size#
Let’s explore how to use the FigureScale class to create precisely sized figures. We first need to import the packages:
import matplotlib.pyplot as plt
import figure_scale as fs
import math  # this is used to get demonstration data
FigureScale Object#
The FigureScale class is the core component of the library. It allows you to define figure dimensions in different ways:
Width and Height: Specify both dimensions explicitly
Width and Aspect Ratio: Specify width and let height be calculated from aspect ratio
Height and Aspect Ratio: Specify height and let width be calculated from aspect ratio
All dimensions can be specified in various units. Let’s explore each approach:
size_a = fs.FigureScale(units="mm", width=100, height=100)
size_b = fs.FigureScale(units="mm", width=100, aspect=1.0)
size_c = fs.FigureScale(units="mm", height=100, aspect=1.0)
Providing all width, height, and aspect arguments will raise an ValueError, the same will happen if any of them is small than or equal to zero.
The available units are:
unit_mapping = fs.UnitConversionMapping()
", ".join(unit_mapping.keys())
'in, ft, yd, m, cm, mm, pt'
Check Unit Conversion for examples on how to add user provided units if needed.
FigureScale is set as a frozen dataclass to ensure constancy and immutability after its creation.
The replace method allows you to create a new instance with modified attributes, whenever convenient:
size_a.replace(width=200)
FigureScale(units='mm', width=200, height=100, aspect=None)
size_a.replace(units="cm")
FigureScale(units='cm', width=10.0, height=10.0, aspect=None)
Notice arguments not provided to replace will be copied from the original instance. Remember just two out of width, height, and aspect can be provided at a time, so disable one of them by setting it to None if you need to set the third one:
size_a.replace(height=None, aspect=2.0)
FigureScale(units='mm', width=100, height=None, aspect=2.0)
Using FigureScale with Matplotlib#
Now let’s explore the different ways to use FigureScale with matplotlib figures.
Under the hood, FigureScale implements the Sequence interface allowing it to be used as a tuple-like object for the figure.figsize parameter in matplotlib.
The values on such sequence are always in inches, as expected by matplotlib.
First, let’s create a figure size and some demo data to demonstrate the different ways to apply figure scaling:
demo_figure_size = fs.FigureScale(units="mm", width=100, height=100)
x = [i * math.pi / 180 for i in range(0, 360, 10)]
y = [math.sin(i) for i in x]
Set as Default#
You can set the figure scale as the default size for all figures by modifying matplotlib’s rcParams:
plt.rcParams["figure.figsize"] = demo_figure_size
or just by using the set_as_default method:
demo_figure_size.set_as_default()
Any new figure created after this will use the specified size by default:
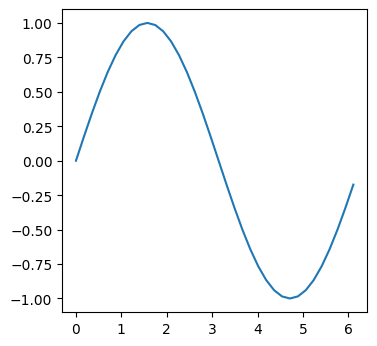
plt.plot(x, y);
Set per Figure#
You can pass the FigureScale object directly to matplotlib functions that accept a figsize parameter:
fig, ax = plt.subplots(figsize=demo_figure_size)
ax.plot(x, y);
Change it Locally#
You can use the FigureScale object as a callable to create a context manager that temporarily sets the figure size for the duration of the with block:
with demo_figure_size():
    plt.plot(x, y)
As a syntax sugar, you can pass extra keyword arguments that are forwarded to matplotlib.pyplot.rc_context, for instance:
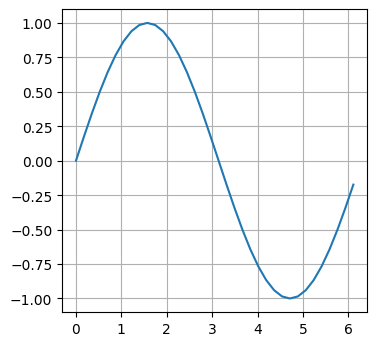
with demo_figure_size(**{"axes.grid": True}):
    plt.plot(x, y)
In a similar fashion, you can call the FigureScale object and use it as a decorator to apply the figure size to a function:
@demo_figure_size()
def plot_demo_figure():
    plt.plot(x, y)


plot_demo_figure()
Extra keyword arguments are also forwarded to matplotlib.pyplot.rc_context, for instance:
@demo_figure_size(**{"axes.grid": True})
def plot_demo_figure():
    plt.plot(x, y)


plot_demo_figure()